Now that the thermal behaviour of the sample is known, having a thermal conductivity of 

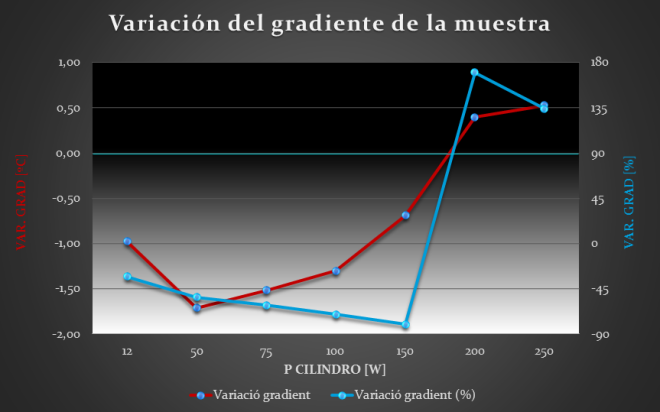
Besides the plots of the variation of the temperature gradient in the sample it will be also plotted the mean temperature variation obtained in the sample, proving, this way, that the ensemble has a higher energy efficiency when the new support is used.
Sample conductivity of 2 W/m·K

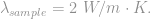
This plot summarizes the results mentioned in the last section. It can be seen, in red, that the greatest gradient reductions in the sample are obtained at low operating temperatures, reaching values that exceed 16ºC. As the operating temperature rises, the gradient reduction obtained in the sample is lower; however, the relative variation, that indicates the effectivity of the new support, keeps increasing. This fact can be explained by the thermal conductivity of alumina. The thermal conductivity of this material has a strong dependency with temperature, specifically, as the temperature rises the thermal conductivity of alumina decreases considerably. This drop in the thermal conductivity makes the alumina tube have a more insulating behaviour at high temperatures than at lower temperatures, being more important, in absolute value, the effect of the change in the tube geometry at lower temperatures, since at high temperatures the drop of the thermal conductivity of alumina itself reduces considerably the temperature gradient in the sample.

It can be noticed that the use of the new support has a positive impact on the ensemble energy efficiency for the whole operating range of the heating device, obtaining the greatest benefits at low operating temperatures. The reason of this decrease on the benefit as temperature rises is the same that has been mentioned in the previous plot: the noticeable drop in the thermal conductivity of alumina at high temperatures causes that the benefits of the new support have a minor importance at high operating temperatures.
Sample conductivity of 20 W/m·K
For the case of a sample with thermal conductivity of 20 W/m·K it is obtained the plot shown on the left (or above). It is noticed that the curves have a very similar shape to the previous ones; however, the main difference between both plots is found in the absoulte value of the gradient variation achieved in each case. As it can be noticed in the left column, the maximum values of variation are also achieved at low operating temperatures; however, due to the higher thermal conductivity of the sample, the maximum reduction obtained is lower than 7ºC, in front of the 16ºC reduction achieved before. Despite that, the variation in percentage has a very similar curve to the one obtained before, both qualitatively and cuantitatively, which indicates that the solution is equally effective.

The sample mean temperature variation curve for the case of 
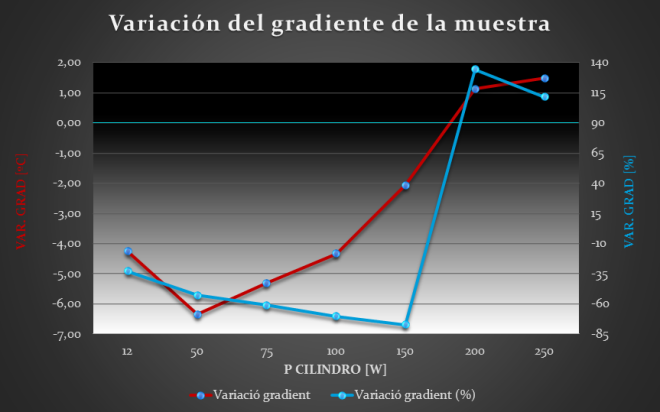
Sample conductivity of 100 W/m·K
Again, it is noticed that the curves have similar tendencies to the ones obtained in the previous plots. The greatest difference is the magnitude of the thermal gradient variations in the sample, obtaining this time a maximum below 2ºC. This fact, as it has been already said, is due to the sample conductivity, because increasing its value it causes lower thermal gradients in the sample. Thus, using the new support the gradient variation achieved is less significant for high values of sample conductivity. However, if the percentage variation curve is analyzed it can be noticed that it is practically the same that has been obtained in the previous cases, that is to say, the effectivity of the new support is proved.
The sample mean temperature variation keeps the same tendency. The difference is that the values are slightly higher than the ones obtained in the previous case.
The benefits of the new support are more evident at low operating temperatures. This is due to the variation of the thermal conductivity of alumina, which decreases as temperature rises, that is to say, at high temperatures the low conductivity of alumina exercises the gradient reductive effect desired. Even so the gradient also gets reduced with the new support at high temperatures (until the phenomenon of thermal inversion is reached).
